Saturday, November 12, 2016

Probable Nifty EW count

As discussed in last analysis on 12th Oct 2016, Nifty seems unfolding wave 4 which is probably completed at 8002.

Breaking 8002 wave 4 will overlap wave 2 which will invalidates whole EW count and needs a recounting, started from 6826.

Lets see how it unfolds...

Nifty Day chart:
By holding 8002, seems wave 5 unfolding now and its targets projection coming around 8821 to 9504.
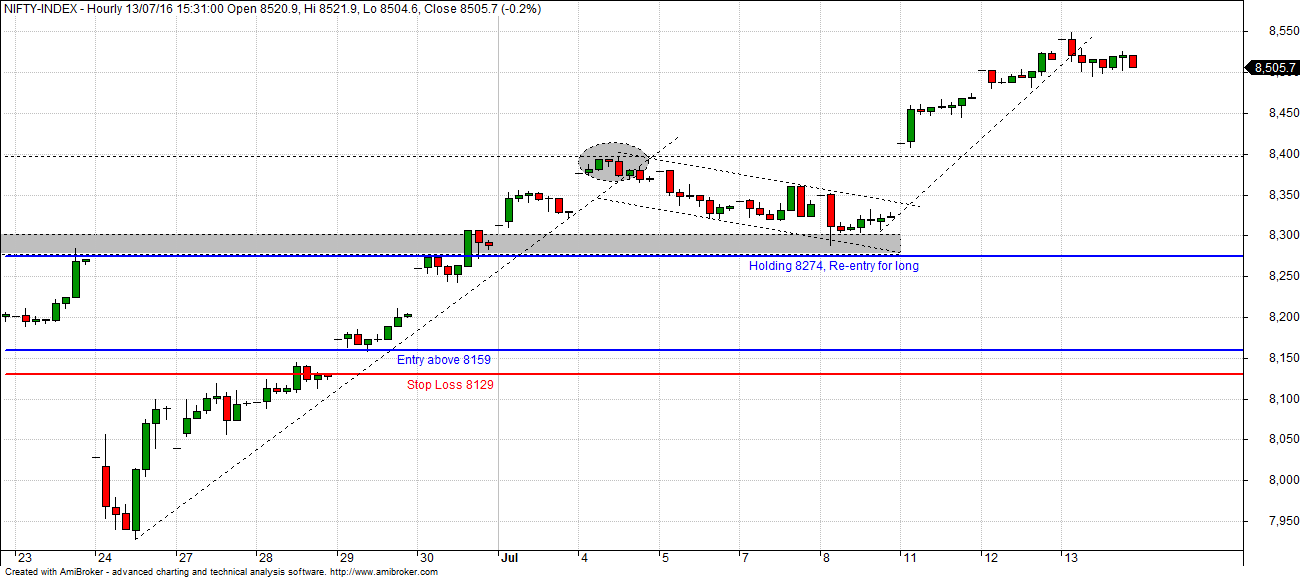
Nifty Hour Chart :
For short term, holding 61% to 80% of last retracement conditions are favoring a bounce. Pattern completion and R:R would help for initiating a trade with small stoploss.


Wednesday, November 2, 2016

Sunday, October 30, 2016

Happy Diwali...!!

May your Diwali be full of light

Wishing you and your family many new
beginnings on this Diwali.


Thursday, October 27, 2016

Probable Banknifty EW Bearish counts contd...

Banknifty found resistance around 19881 (mentioned in last post) and "Sell on rises" worked well.
It seems wave 3 is unfolding with sub waves. 19374, 19244, 19044 are likely supports of last retracement.

Lets see how it unfolds...


Tuesday, October 25, 2016

Probable Banknifty EW Bearish counts

It seems inner and higher 5s are done around 19923. Any upmove above it invalidate current counts and would require a re calculation. 
However current conditions are suggesting a "Sell on rises" and holding 19712 resistances would be 19793, 19818, 19842, 19881.

Lets see how it unfolds...


Sunday, October 23, 2016

Probable Banknifty EW Bullish counts contd...

Banknifty wave 4 correted up to 23% and started unfolding wave 5 now. It seems wave 5.iii already completed and wave 5.iv is unfolding.

Lets see how it unfolds...


Probable Banknifty EW Bullish counts contd...

Banknifty wave 4 correted up to 23% and started unfolding wave 5 now. It seeems wave 5.iii already completed and wave 5.iv is unfolding.

Lets see how it unfolds...


Thursday, October 20, 2016

Probable Banknifty Bullish EW counts

It seems Banknifty completed its wave 3 at 19723 and staying below, its likely wave 4 unfolding.
As wave 3 is extended more than 200% of wave 1; wave 4 can correct up to 23%-38% of wave 3 which is around 19535-19419.

Lets see  how it unfolds...


Wednesday, October 12, 2016

Probable Nifty EW counts

It seems Nifty completed its larger 3rd wave at 8969 and currently 4th wave is unfolding, which may complete around 8490, below which it could head to 8343-8195.

Lets see  how it unfolds...

Nifty Daily Chart:


Being in a corrective mode, the price pattern/ behaviour could take any form namely abc-x-abc or just an abc(3-3-3) and so on. Prices have been making Lower Highs and Lower lows since the “8969”. Till this pattern continues, corrections do.

Nifty Hourly Chart:

For short term, Staying above 8709(38% of last retracement)conditions are favoring a bounce but with a lack of confidence so one needs to be careful to initiate any trade with small stoploss.

Nifty 15 Minutes Chart:


Sunday, July 31, 2016

Nifty Retrospect for July’16 Series

- Nifty triggered a Buy on 29th June, since then price stayed above SAR (10 EMA) for July series.
- Buy entries marked on Hrly chart with Stop Loss. 


Wednesday, July 13, 2016

13 July - SAR Trades

- Long re-entry surged more than 3% from 8288. 
- Prices gather momentum with shallow consolidations. However profit booking is a key of the game.


Monday, July 11, 2016

11 July - SAR Trades

- Long Entry triggered on 29 June, since then TGTs are achieving with out hitting Stop Loss.
- Part booked around 8375-95 as Nifty surged almost 3% after Long Signal triggered. 
- Nifty retraced and prices found support at previous resistance around 8285-97.
Re-entry for long is prudent holding 8274.


Wednesday, June 29, 2016

29 June - SAR Trades

- 8159 was the SAR for the day. Nifty gapped up above SAR, but made a low of 8158 which was a low risk entry point for Long trade.
- SAR (8159) marked on chart by BLUE line and STOP LOSS (8159-30=8129) by RED line.
- In 2nd half, Nifty rallied till R3 pivot point.
- Long entries marked on chart by circle.


Thursday, June 23, 2016

24th June 16 – Nifty Pre-Market View


SAR Trades

Today onwards will post only SAR Trade setups...

- 8186 was the SAR for the day; Nifty made a low of 8188 which was a low risk entry point for Long trade.
- SAR (8186) marked on chart by BLUE line and STOP LOSS (8186-30=8156) by RED line.
- Nifty rallied in 2nd half and rallied till R2 pivot point.


Tuesday, June 21, 2016

Probable Nifty EW counts

Seems Nifty may complete its B wave around 8300 and may take U turn. Invalidation point around 8305.

Lets see  how it unfolds...

Nifty Daily Chart:

Nifty Hourly Chart:

Nifty 15 Mins Chart: 
Current wave structure suggesting an ED, iv unfoling and may complete either at 8166 or 8144 or 8111. 

Final v wave may complete at 8304.

Monday, June 20, 2016

20 June Intraday Chart

- Nifty gapped down today; but ORB broke upside and rallied till end of day.
- Found resistance in between R2 and R3 pivot.
- Long entries marked on chart by circles.


17 June Intraday Chart

- Nifty gapped up today; broke the ORB but didn't fall much. Overall a rangebound day.
- Gave multiple sell signals; marked them on chart by circles.


Thursday, June 16, 2016

16 June Intraday Chart

- Nifty gapped down today; broke the ORB and found support between S2 and S3 pivot.
- Bounced back and retraced more than 61% of last swing.
- Short and Long entries marked on chart by circle.


15 June Intraday Chart

- Nifty gapped up and traded in a range for 3+ hours.
- ORB broke up side and rallied till R3 pivot.


Wednesday, June 15, 2016

14 June Intraday Chart

- Nifty Trend is down, with prices presently staying below DLEma (8145).
- Nifty Gapped up today and ORB broke down; almost retested y'days low and bounced back.
- Short and Long entries marked on chart by circles.


Tuesday, June 14, 2016

13 June Intraday Chart

- Nifty Gapped down today and broke the ORB; found the support between S2 and S3 pivot.
- Bounced back and retraced alomst 50% of last swing.
-  Long entry marked on chart by circle.


Sunday, June 12, 2016

10 June Intraday Chart

- ORB broke upside and gave a buy signal.
- Up Rally could not sustain at higher level.
- Broke the Intra support and started falling back.
- Long and Short entries marked on chart by circles.


Friday, June 10, 2016

09 June Intraday Chart

- Trending day; ORB broke downside and gave a Sell signal.
- Short entries marked on chart by circles.


Wednesday, June 8, 2016

08 June Intraday Chart

- Rangebound day; No sizable trades. 


07 June Intraday Chart

- Nifty Gapped up today and broke the TL of last 2 days correction. It was a clear early indication of long although it's a policy day.
- Post RBI policy announcement, markets made new high/low but again fall back in range for some time.
- Breaking initial range rallied further and print the new high of this year.
- Long and Short entries marked on chart by circles.


Monday, June 6, 2016

06 June Intraday Chart

- ORB broke downside but again fall back in range; Initial range was hardly 23 points.
- Price retraced almost 80% of initial days range and triggered the short trade.
Short entry marked on chart by circle.


Saturday, June 4, 2016

03 June Intraday Chart

- Nifty Gapped up and hit 8262, which is a Mid point of R1 and R2 pivot. 
- Short trade would be a prudent as Nifty didn't cross 8262 whole day.
- Short entry marked on chart by circles.


Nifty hit the Golden Ratio

Nifty hit the 8243, i.e 61.8% of 9119-6826 this week. Also this week Tuesday was a May month end and Nifty closed above 5 MHEMA after long 14 months which indicates the strength on higher TF now.


Coming week would be an interesting week to see whether price could surge ahead or show some correction.

Saturday, May 28, 2016

BankNifty gave a flag breakout on Weekly Chart

Same as Nifty, BankNifty also broke the TL in 3rd week of April, since then prices consolidated in range of 847 points for 5 weeks and this week gave a nice flag breakout.

BankNifty should achieve 19809 in coming 4 to 5 weeks as per Flag Pattern calculation. Pattern negation point is 16950.